Portfolio demonstration of a data-science workflow used to identify suspicious funding behavior in a DEX ecosystem.
The approach combines first-funder analysis, graph structure, and temporal/value clustering.
Visualizations are used as a human sanity check on top of algorithmic detection.
Graph Analytics
Anomaly Detection
Temporal Clustering
Sybil / Coordination Signals
Explainable ML Workflow
Problem
In many DeFi contexts, attackers create many wallets to simulate organic usage, exploit incentives, or
manipulate markets. A common coordination pattern is a first-funder (or small set of funders)
seeding many downstream wallets shortly before they act.
Goal: detect coordinated funding behavior that is statistically unlikely under normal activity,
then verify the result with graph and time/value visual checks.
What “first-funder analysis” means here
Identify initial funding events for wallets (or the earliest upstream funding source).
Extract features: time gaps, funding value distributions, burstiness, repeated patterns.
Link wallets via a directed funding graph: DEX → funder → funded wallets, and downstream hops.
Why graphs matter
Sybil behavior often forms recognizable motifs (star, chain, k-ary tree, mixed).
Graphs reveal coordination that is hard to see in raw transaction tables.
They provide interpretability: humans can validate what the model flags.
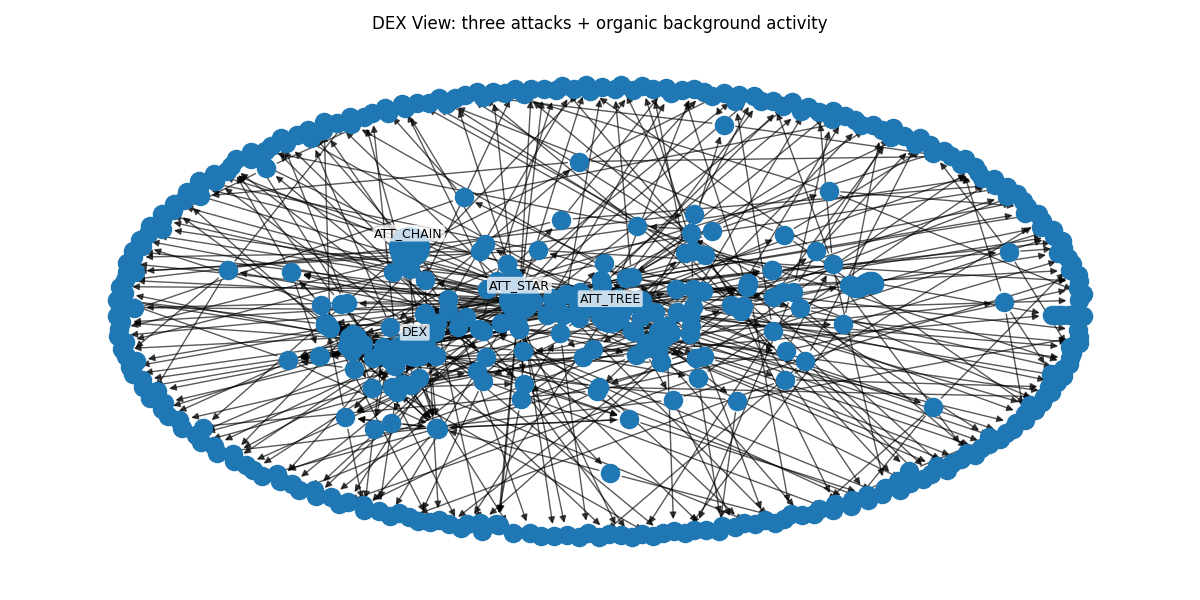
DEX View: Mixed Attacks + Organic Background
Real systems are not clean motifs. From the DEX perspective, multiple attacker components can coexist
alongside normal user activity and incidental cross-links. This makes it significantly harder to detect attacks.
Scenario: multiple attacks present
Organic noise: regular users transact normally
Result: impossible to detect attacks
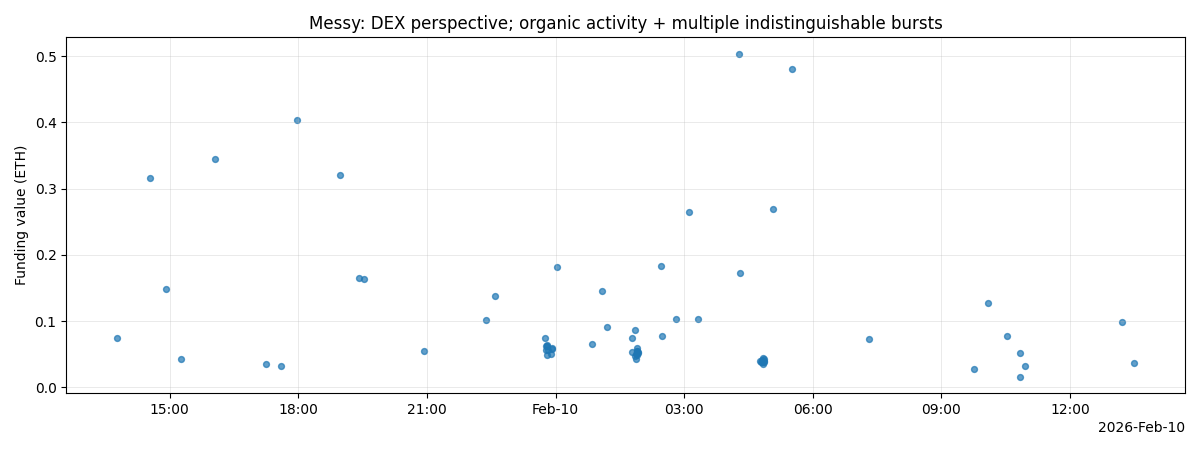
Combined DEX perspective: multiple attacker patterns plus organic nodes and cross-links.
Scatter appears mostly random; dense coordinated bursts can be visually hard to distinguish without features.
This is the most realistic validation view: models should still isolate suspicious substructures even when
the overall graph is noisy.
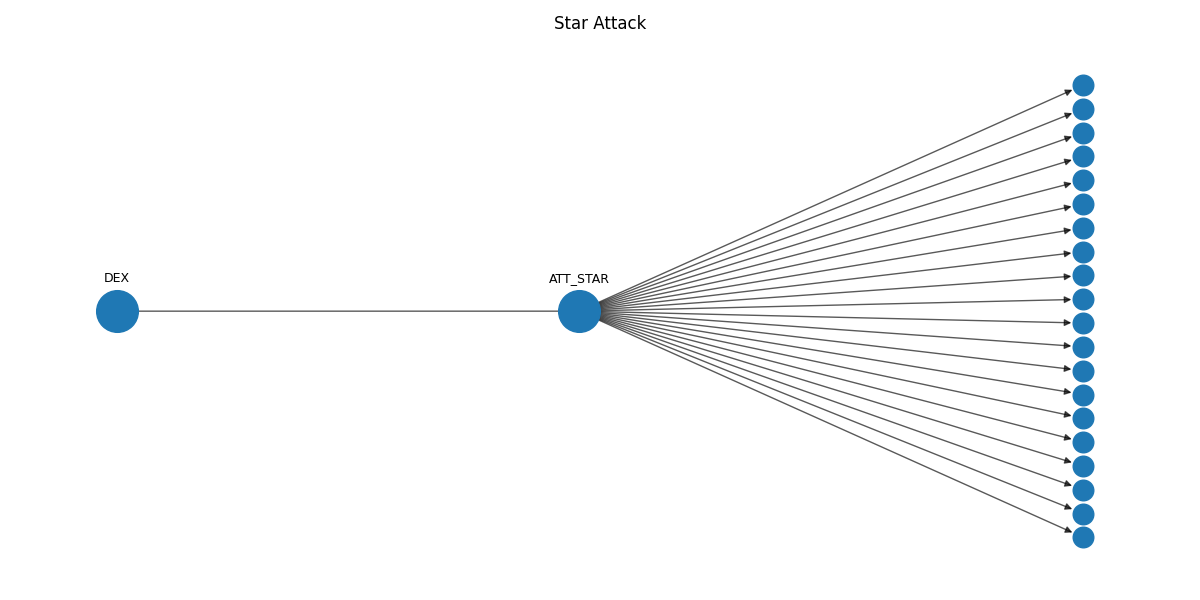
Attack Motif: Star Funding Pattern
A single source funds many wallets in a short window with similar amounts.
Graph motif: star / hub-and-spoke
Signal: high out-degree funder
Signal: tight time/value clustering
Graph view of a star pattern: a single attacker wallet fans out to many funded wallets.
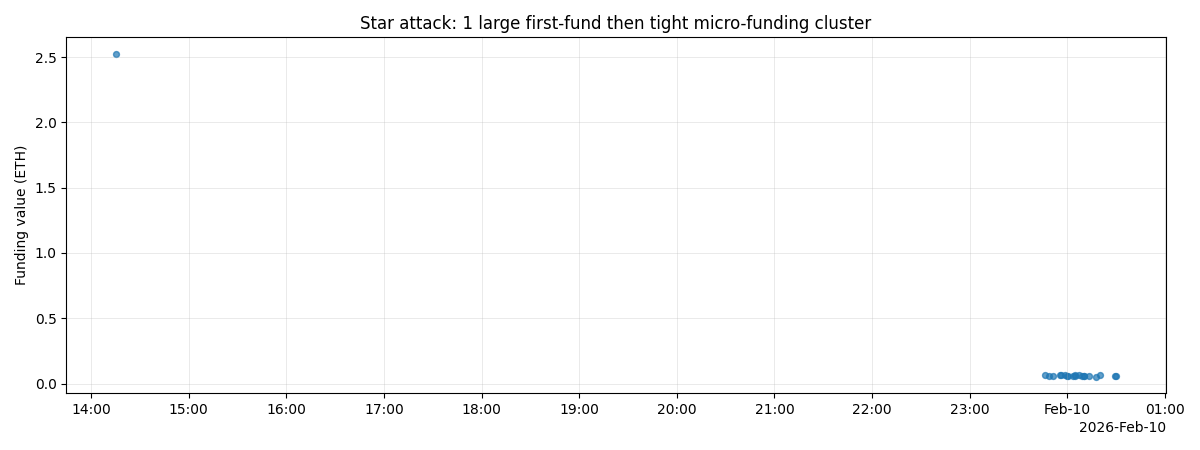
Funding scatter: one large initial funding followed by a dense cluster of similarly sized micro-funds.
In an automated pipeline, this can be detected via out-degree thresholds, burstiness metrics,
and distributional similarity of funding values.
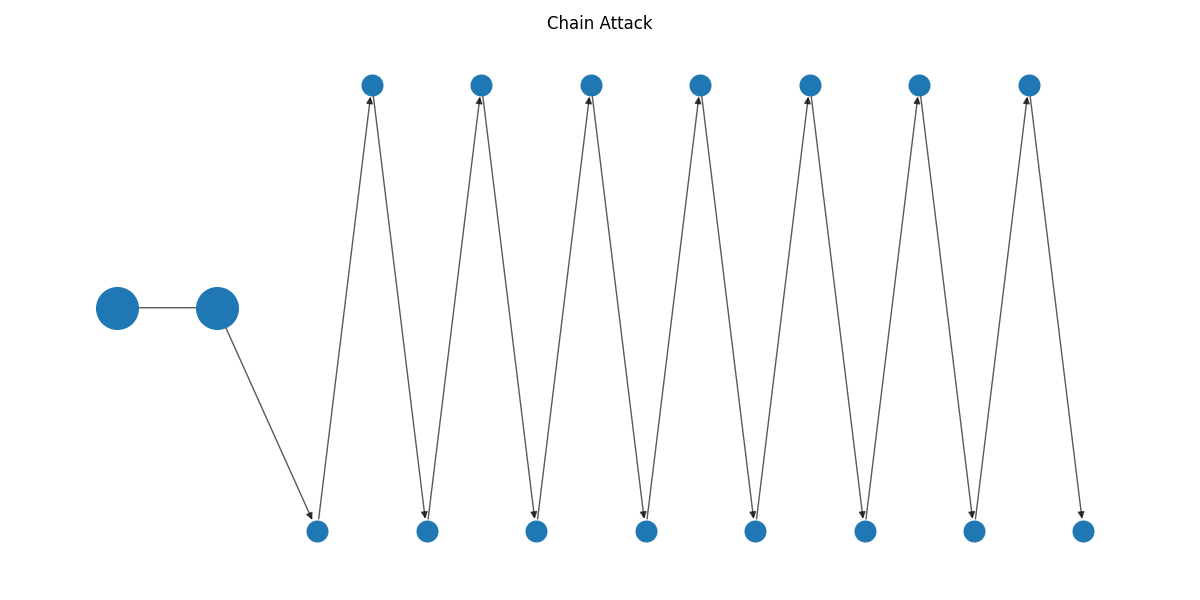
Attack Motif: Chain Funding Pattern
Funds are relayed wallet-to-wallet to obscure provenance and make attribution harder.
Graph motif: path / relay chain
Signal: long directed path length
Signal: repeated small transfers
Graph view of a chain: attacker initiates a relay path through multiple wallets.
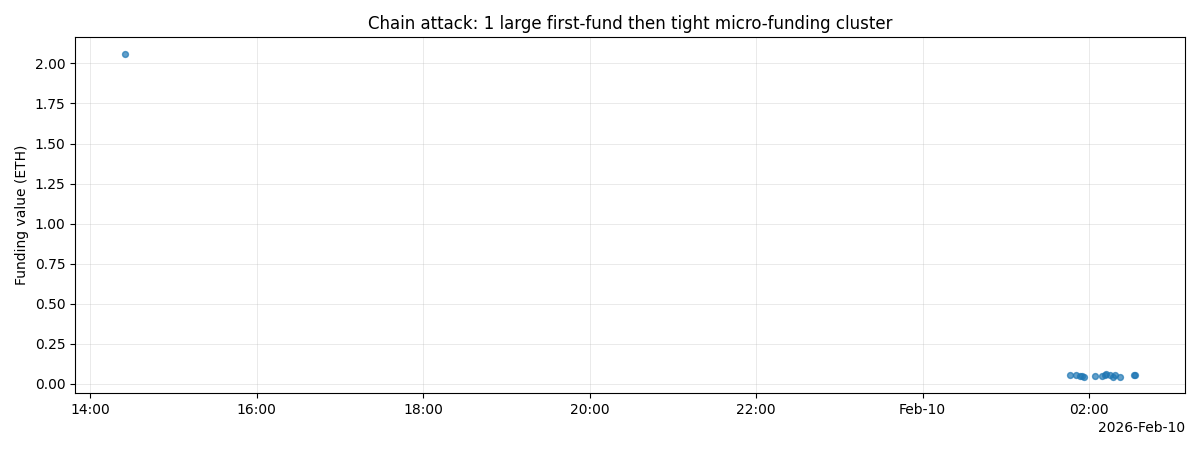
Funding scatter: a first-fund event followed by clustered micro-funding consistent with coordinated activity.
Programmatically: detect unusually long directed paths, high edge-to-node ratios in a component,
and repeated transaction “shapes” across hops.
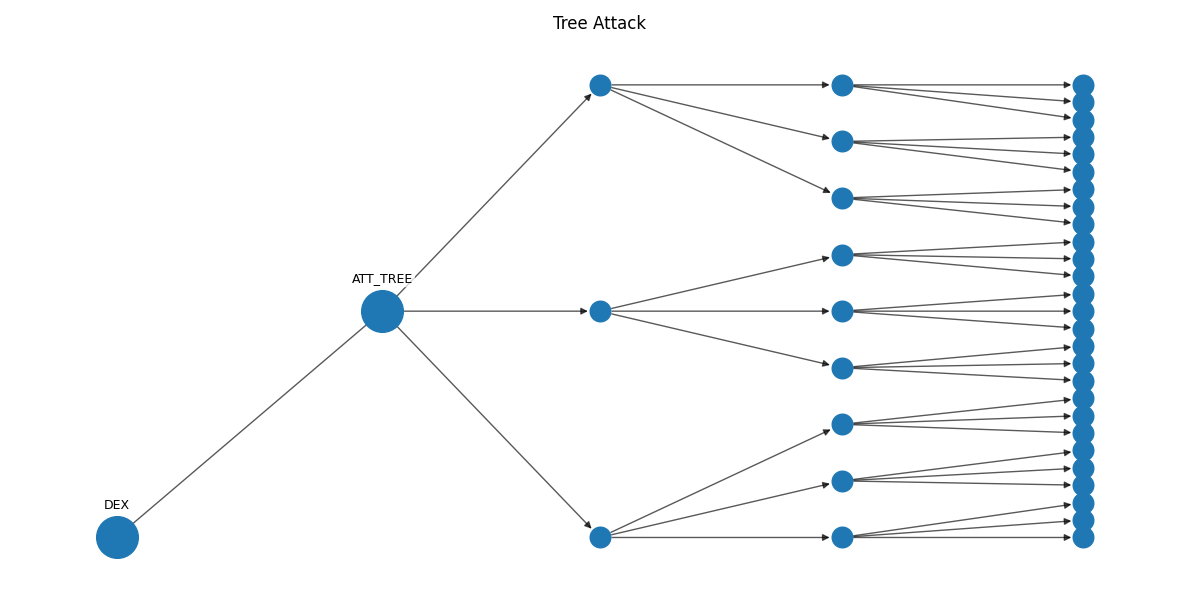
Attack Motif: Layered Tree Funding Pattern
Funds branch out in layers (k-ary expansion), often aligned with bursts of downstream wallet activation.
Graph motif: k-ary tree
Signal: layered burst structure
Signal: repeated layer patterns
Graph view of a tree: attacker branches funding across layers to scale wallet creation.
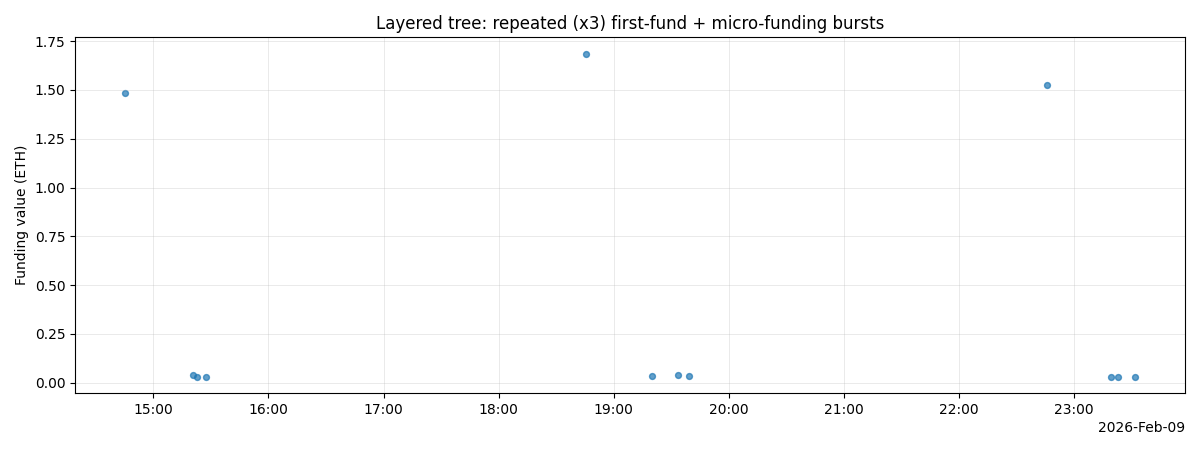
Funding scatter: repeated bursts (layered first-funds + micro-funding) consistent with staged activation.
Programmatically: estimate branching factor, layer depth, and periodic “burst cadence” in time/value space.
Algorithmic Detection (How attacks are identified)
The visuals are not the detector; they are the explanation layer. The detection step uses graph + temporal features
to score suspiciousness.
Graph features (structure)
Degree anomalies: unusually high out-degree or in-degree for funders.
Component structure: stars, long paths, branching trees, dense subgraphs.
Centrality: funders that dominate connectivity (e.g., high betweenness in a chain).
Motif counts: frequency of small subgraph patterns relative to baseline.
Temporal/value features (first-funder signals)
Burstiness: many funds in a tight time window vs. organic spread.
Value similarity: unusually low variance in funding amounts.
Layer cadence: repeated “fund then activate” cycles (tree layers).
Upstream provenance: shared first-funder across many wallets.
Modeling stance: suspiciousness scoring can be implemented as rules/thresholds, unsupervised anomaly
detection, or supervised classification (when labels exist). The key is feature engineering that captures coordination.
Example scoring sketch (conceptual):
- Build funding graph and compute components around DEX
- Extract features per suspected funder/component:
out_degree, path_length_stats, branching_factor, component_density
time_burst_score, value_similarity_score, repeated_burst_cadence
- Combine into a risk score
- Use these plots as a sanity check for top-ranked findings
Why include visual graphs in a data-science workflow?
Interpretability: stakeholders can understand why something was flagged.
False positive control: organic communities can resemble motifs; visuals help validate context.
Communication: graphs + scatter plots are compact artifacts for reports and incident review.
In production, the pipeline typically outputs ranked clusters (and their evidence),
while visuals are generated for the most suspicious cases to support review and triage.
What this demo demonstrates
Data science competencies
Feature engineering (graph + temporal/value).
Synthetic data generation for controlled experiments.
Evaluation through interpretability artifacts (sanity checks).
Clear narrative from detection → evidence → decision support.